Wake County schools have been under fire in recent months for a lack of school capacity in Raleigh. Now the school system is preparing an analysis for this summer on where to build new schools.
Read More: Raleigh’s Disparity in Growth and School Building
The organization that predicts student distribution for Wake hasn’t done a major update since 2008—before the recession started to be felt.
“We can sense that there are going to be some pretty significant changes on the next update,” said Mike Miller, a lead researcher on the project. “Things are changing.”
Miller works with the Operations Research and Education Laboratory (ORED) which is a subsidiary of NC State University’s Institute for Transportation Research and Education (ITRE) the organization contracted by Wake.
He said despite expecting change, it’s hard to quantify exactly how those changes play out in terms of student populations. Miller said he is seeing fewer large-scale subdivisions in the outer part of the county and more multi-family housing.
In other words, it’s possible the recession changed the dynamics of countywide student distribution, which may affect current thinking of where new schools need to be placed.
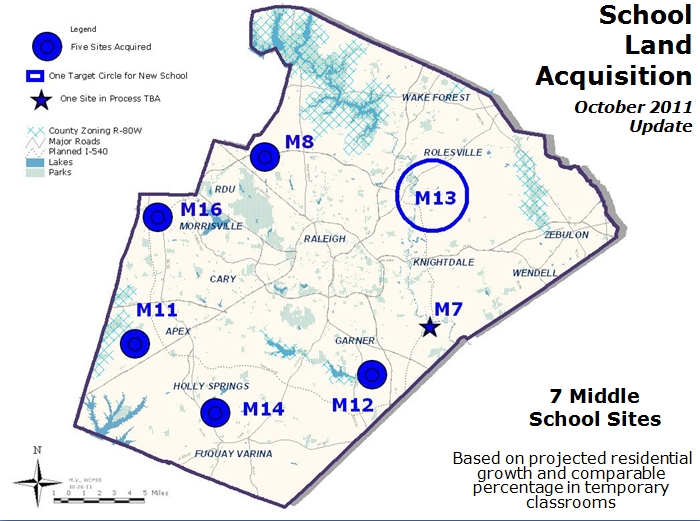
These maps show areas identified by WCPSS where new school construction should take place. Click on an image to view full size.


School capacity is currently being stretched in five areas of the county — downtown Raleigh, northwest Cary, Apex, north Raleigh and Wake Forest. Downtown Raleigh is the only area ORED didn’t anticipate.
It’s also the trickiest place of all to build new schools. Right now, officials are in the preliminary stages of looking at two former schools to be reconverted.
Another option Superintendent Tony Tata has mentioned is lowering the percentage of magnet seats in the downtown magnet schools. Earlier this year, the school board voted to do just that at Poe Magnet Elementary.
At this point, Miller said it’s impossible to know if the modeling could’ve anticipated downtown Raleigh’s capacity issues. The fact that demand exceeds capacity could be a product of downtown Raleigh schools being over-chosen during the recently introduced controlled-choice plan, rather than increased student population in downtown, he said.
How ORED modeling works
When it was initially contracted by the school system in 2005. ORED began by dividing the county into more than 6,000 planning units, or regions.
ORED then reached out to county planners and city planners at each of Wake’s 13 municipalities, asking them to fill in information about zoning, permits, developments and density for each planning region.
“It was a big, big undertaking,” Miller said.
For classification purposes, planners graded each region on more than a dozen criteria. (Some of these are likely to change in the upcoming study, said Miller, especially since Raleigh has updated its Comprehensive Plan.)
All the information was put into a database and fed through a program called the Student Population Distribution Model (SPDM.) The SPDM then spit out a prediction for student distribution during the next 20 years. (The numbers are less reliable the further out you get, noted Miller.)

This map shows growth by volume from 2002-03 to 2008-09.
This summer, as during the only other major update in 2008, planners will only revisit planning regions where the predicted student population was significantly more or less than expected.
Once the SPDM produces its optimal school sites, the data is released into the school system’s atmosphere of budget realities and political pressure. The process becomes less scientific.
Based on available land, available resources (i.e. money) and what areas need new schools the most, planners at the school system develop a map of “circle areas” where they’d like to build new schools that’s more realistic than the idealism of the SPDM.
For instance, the last time the SPDM delivered its map of optimal school sites, several were located inside the Beltline, Miller said. However, no schools have been built inside the Beltline in the past 12 years and few are planned for construction inside its boundaries in the future.
“If you look out at the more rural areas—the Garners, the Rollsvilles, places like that—it makes sense to build a school that will minimize the travel distance for students in that area,” Miller said. “And so of course there is more distance in between people as you work your way outside of Raleigh.”