Last week’s education news highlighted Wake County schools’ improvement in test scores across most student groups. But an analysis of long-term performance data by the Record shows that some of Wake County’s most at-risk groups are not performing as well as in the past.
The difference in performance across various subgroups is known as the achievement gap, and Wake has many: the difference between poor and wealthier students; white and black students; and the difference between whites and Hispanics. These are the most noticeable.

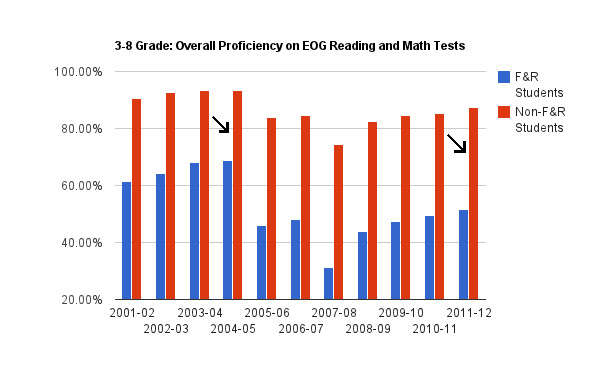
This chart shows the difference in passing rates between economically disadvantaged and economically stable students. It represents the combined passing rate in reading and math for children in 3rd through 8th grade. In 2005 the gap was 25 percent. Now it is 36 percent.
Economically stable children (as defined by those who do not qualify for free or reduced-price lunch) are far more likely to be proficient in reading and math than economically disadvantaged (E.D.) kids.
Only 52 percent of E.D. kids in 3rd through 8th grade passed End of Grade tests in both reading and math last year. That’s compared to 87 percent of non E.D. kids—a 35 percent achievement gap in proficiency.
But the gaps are comparable when looking at race also. The proficiency gap between white and black students was 36 percent last year. Between white and Hispanic students, it was 32 percent.
Before changes to the end-of-grade tests in math (2005-06) and reading (2007-08) made them more difficult, the racial and economic achievement gaps in proficiency were much smaller.

The difference in the percentage of 3rd through 8th graders who passed both reading math EOG’s based on socioeconomic status.
These test changes affect vulnerable groups more, said Brad McMillen of Wake schools, because vulnerable kids are often already on the edge of the passing score.
Essentially, the changes meant that the score needed to pass increased.
The test changes hurt all groups, but because of the phenomenon McMillen describes, they hurt vulnerable groups most. Accordingly, the largest achievement gaps occurred in the years the test changed.
“When you move that line you are moving a lot more of those kids below it than the others,” McMillen said. “That hit is going to fall disproportionately.”
But the last test change was four years ago, and a Record analysis of proficiency data shows that the recovery has been unequal.
The fact that the proficiency gap was narrower before the test changed doesn’t definitively show that the relative performance of vulnerable groups has gone down.
To triangulate the phenomenon, we compared passing rates of vulnerable groups at the county level to the average passing rate of the same groups at the state level. We did the same thing with stronger groups.
Click on the image to view full size.


The passing rate of economically stable children has stayed consistently above the state average for the same group of children. But Wake’s economically disadvantaged children are passing at a lower rate than their peers at the state level than in the early 2000s.
The same is true when comparing black and Hispanic students to whites. It shows that Wake’s vulnerable student groups are having a more difficult time on the road to proficiency than they once were.
Wake County’s school system has experienced myriad changes since that time.
The percentage of F&R students has risen from 23.4 percent in 2003-04 to 33.3 percent last year and the distribution of those students is less spread out, as the Record previously reported.
Hispanic students have almost doubled their market share, increasing from 8.2 percent of the population in 2004-05 to 15.0 percent last year.
Around the same time the test changes took place, the school system also experienced unprecedented growth—to the tune of 7,500 new students in 2006-07.
In more recent years, the system has seen reductions in the number of central office staff, school clerical staff, teacher assistants and the money spent on school supplies.
The causes for changes in the proficiency gap come from a mix of factors.
As school administrators note the achievement gap has gotten slightly smaller in the past four years, particularly in 2011-12. But the long-term trends raises the question of whether Wake could be doing better with its vulnerable students.
We’ll examine that question for the next three Mondays in our ongoing achievement gap series as well as look at the causes and possible solutions for the achievement gap.
Check out the charts below to see a visual representation of what we describe above.


