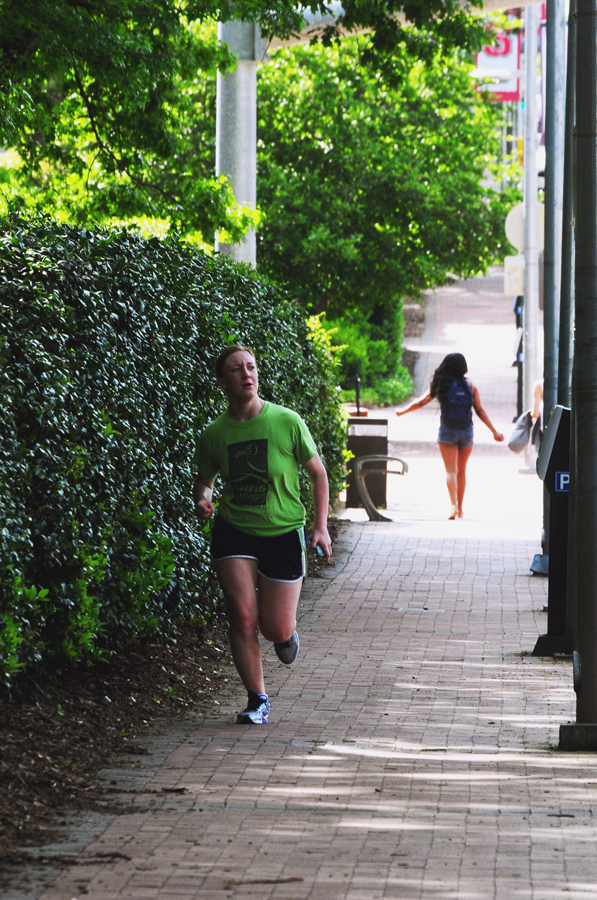
Hillsborough Street is changing, but it’s alive as ever. Samantha Mitchell, a junior at NC State University, said she often receives encouraging high-fives from “random strangers” while running the Hillsborough loop around State’s campus.

Strava
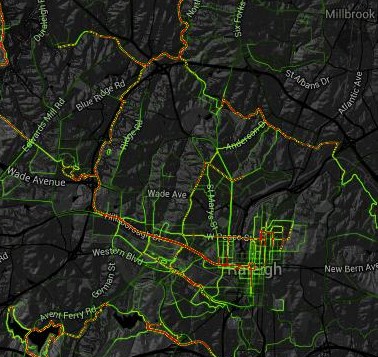
The Strava Heat Map for Raleigh shows that Hillsborough is the most active road in Raleigh for runners and cyclists
Mitchell is hardly alone in making that loop. A heat map produced by data collection firm Strava Labs shows Hillsborough as the most heavily-trafficked exercise corridor in Raleigh outside of the greenway and parks system.
Within the parks system, the heat map shows Lake Crabtree to be home to the most activity.
The Strava Heat Map
The heat map for the Raleigh area includes data from more than 7,000 users and 200,000 individual bike trips. It includes cyclist and runner behavior from the past six years.
These individual users upload the data from various fitness tracking devices and apps to the Strava system.
This map data, incidentally, has appeared in presentations by the city of Raleigh when discussing future pedestrian planning.
Strava itself works to promote what it calls “social fitness—connecting and competing with each other via mobile and online apps.”
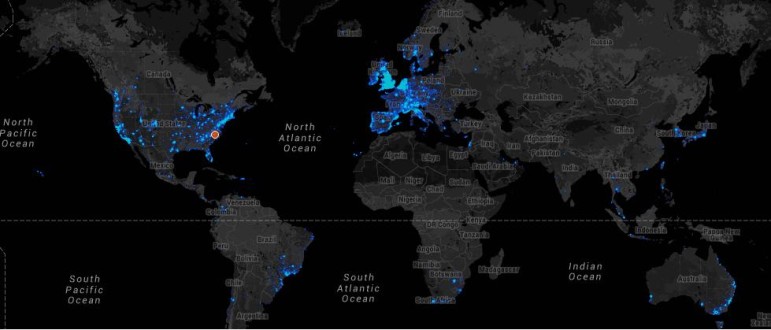
It describes itself as an organization that connects athletes from a global community; and indeed, their heat maps do span the globe. Countries with reported data include everywhere from the Ukraine to South Korea.

Strava
This map indicates where Srava users have uploaded their exercise data
Because the data is entirely self-reported by a certain demographic of exercise aficionados who choose to use the service, the maps themselves are not meant to be utilized in any sort of city or regional planning endeavor.
“The Strava heat map is not a planning tool, but rather a piece of art that is designed to get groups discussing cycling around the globe. It has done this,” said Brian Riordan, Strava Metro’s lead manager.
“The challenge comes when you start to ask questions [of] the heat map, as it does not answer them. It is a static picture.”
Planing for a More Walkable City
Planning tools, however, are necessary for city infrastructure. In Raleigh, bike and pedestrian planning is handled separately from greenway planning. Greenway planning tends to be less technical and involves filling in missing links in a system.
Bike and pedestrian planning require metrics beyond what Strava can provide for how and where necessary infrastructure should be built. However, this infrastructure planning can sometimes line up with what Strava’s data is showing.
According to Riordan, a number of different correlation projects have been conducted in areas such as Seattle, Brisbane, Perth and London which revealed that “Strava’s use highly reflects larger populations.”
In Raleigh, the incorporation of bike lanes on Hillsborough Street, for example, was not originally in the Phase I plan, but was later added in due to requests from Raleigh residents.
“Some people don’t like the design of the bike lane relative to the on-street parking, but all in all, most folks have indicated the bike lane has helped and has resulted in an increase in bicycle ridership,” said Eric Lamb, the manager of the city’s Office of Transportation Planning.

Karen Tam / Raleigh Public Record
John Lawlor commutes to the gym on his electric skateboard
Regarding the Strava heat map, Lamb said, “there’s no reason to think the Strava mapping isn’t reliable…but it does not capture the full extent of the cycling population and biases the outcome on two fronts.”
Two biases could be recreation, as “most people only track their rides for exercise and not necessarily for commuting,” and income level, because devices necessary to utilize Strava can be relatively expensive.
John Lawlor, 48, commutes to the gym on an electric skateboard and is among those applauding the construction of bike lanes along Hillsborough Street.
“It is a good thing. [Hillsborough] is one of the flattest east to west streets for biking or running,” Lawlor said. “I’m grateful they’ve started to plan for structures like these. We need it.”
